Feedback on Water Use Reduces Residential Demand
Organization : B-Hub Editorial Team
Project Overview
Project Summary
Households with smart meters received informational postcards with either (1) general advice about how they could save water, (2) numbers of other “low water use households” that performed water-saving behaviors, or (3) tailored specific information about where water was being used in their own home.
Impact
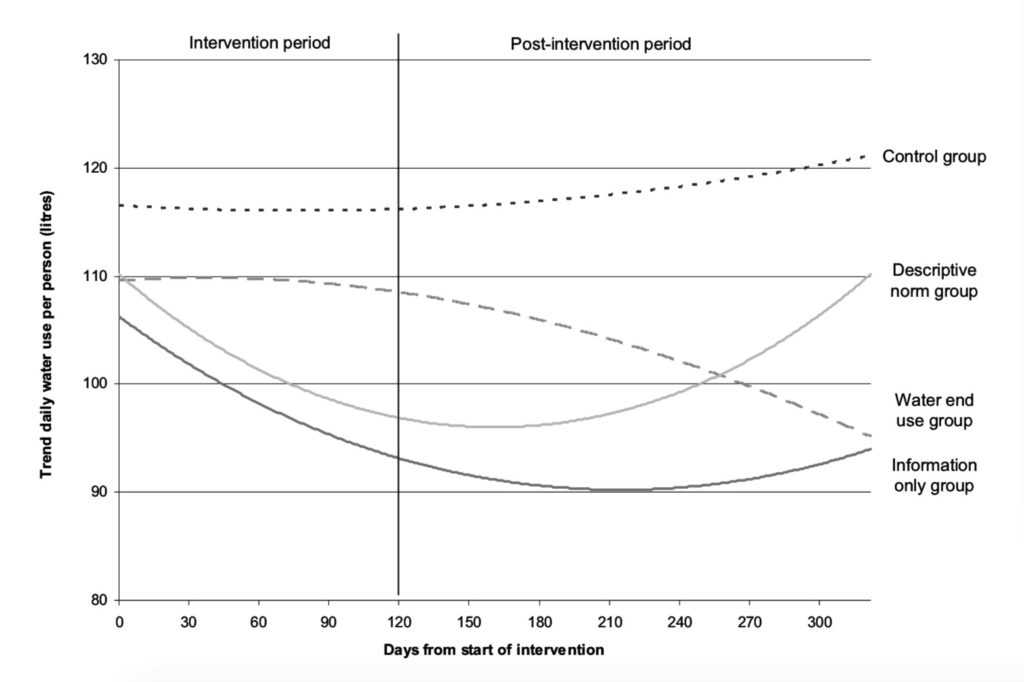
During the intervention period, mean water use among all households dropped by 10.29 liters (7.3%) per person per day and the median dropped by 7.6 liters (6.2%). While the information only and descriptive norm postcards resulted in a quicker drop in water consumption during the intervention, the changes were lost over time, whereas those who received feedback on their own household’s water use showed a longer-term reduction in demand.
Source
Source
Challenge
Human activities often place unsustainable demands on water resources. Managing water demand is an essential element of future water security. While price increases or stringent mandatory policies could reduce water demand, there are many concerns with these approaches, such as equity issues, limits to the price elasticity of residential demand, necessary political will, and whether they result in long term change. Voluntary measures may be critical to producing long-term reductions in residential water consumption.
Design
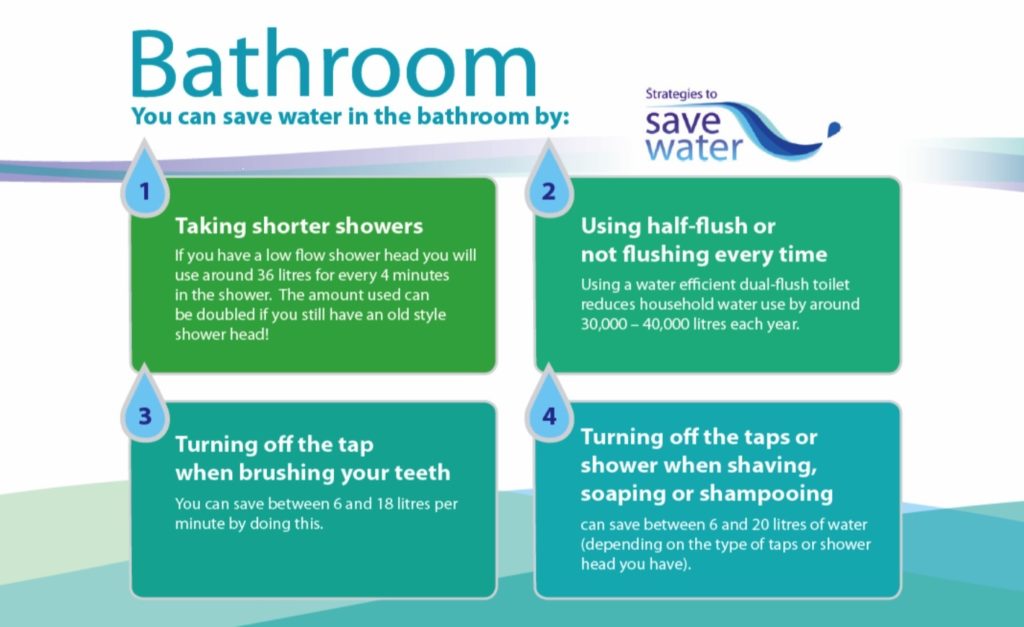
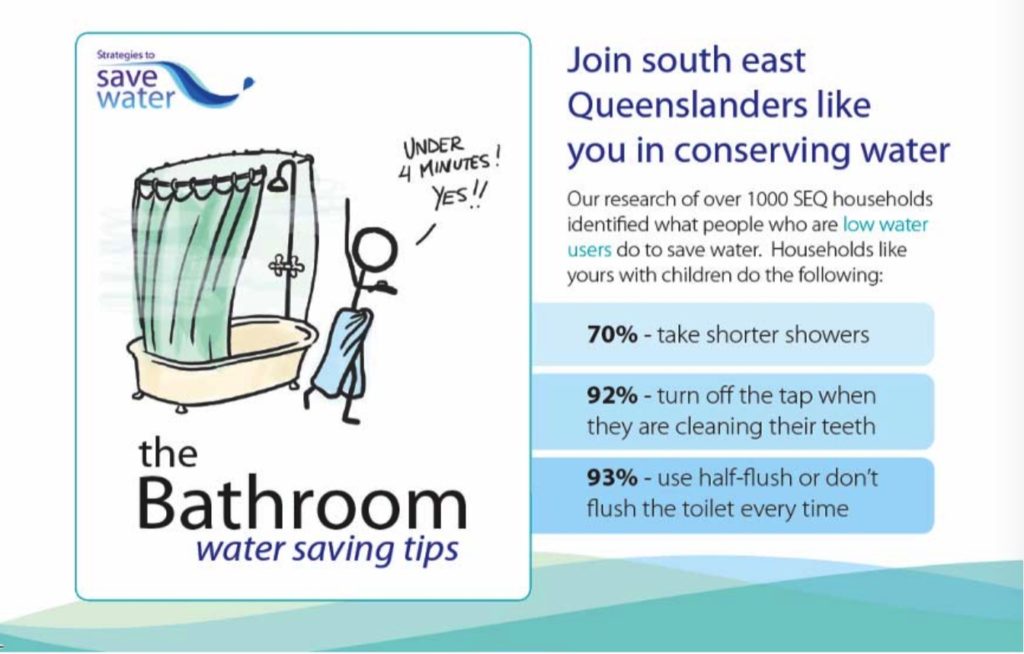
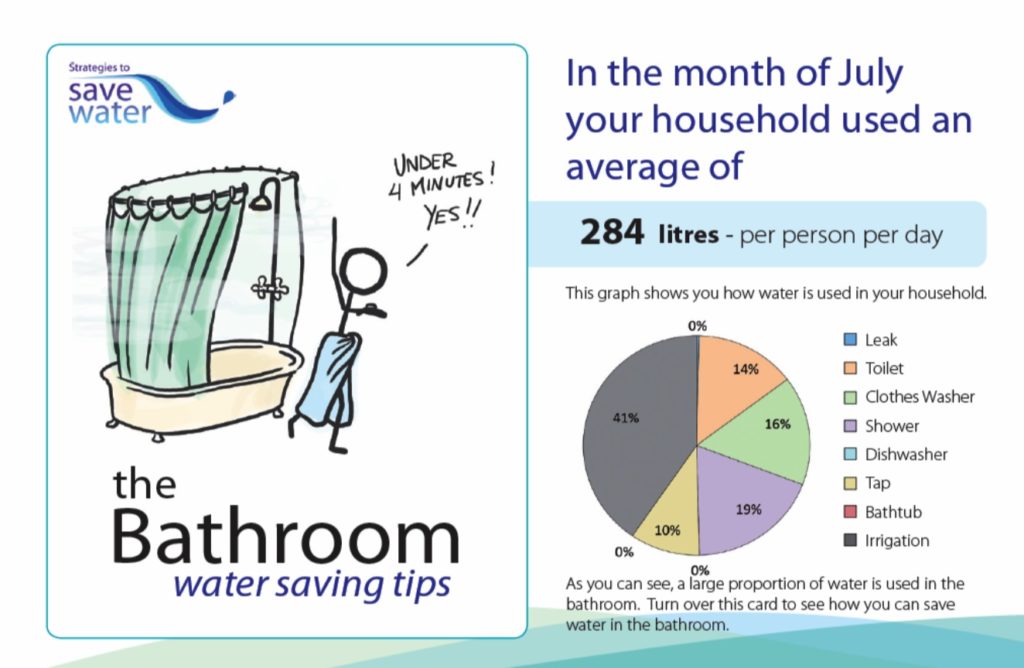
Households in South East Queensland who had their home water meter replaced with a “smart” meter were mailed a four-part series of postcards monthly. One side of each postcard provided a set of tips for how to save water in a particular part of the house (bathroom, laundry, kitchen) or through checking and fixing leaks. The postcards also included a cartoon graphic related to the water conservation focus for that period. For example, the postcard aimed at reducing water use in the bathroom had a cartoon relating to taking short showers. Three different types of information were included on the overleaf side of the postcard:
- Information only: General advice about how households can save water with a larger version of the cartoon graphic.
- Descriptive norm: 1) A cartoon graphic about saving water; and 2) statements about the percentage of low water using households of similar composition to theirs who reported always or almost always performing a certain water saving behavior, based on a previous survey. For example, the bathroom postcards said: “Join South East Queenslanders like you in conserving water. Our research of 1000 SEQ households identified what people who are low water users do to save water. Single person households like yours (Households like yours with children/Households like yours with multiple adults) do the following: 78% (70%/84%) take shorter showers; 90% (92%/90%) turn off the tap when they are cleaning their teeth; 94% (93%/93%) use half flush or don’t flush the toilet every time”.
- Water end-use feedback: Tailored feedback about how much water they use based on the smart water meter installed in their home. Residents received water saving tips along with tailored information about the breakdown of water used in various parts of their own household. Two postcards used a pie chart to draw attention to the large proportions of water used in the bathroom or kitchen, another focused on water use in the laundry, and the last either reminded participants that a leak had been detected in their home, or that one may occur in the future if no leak had been previously detected.
Two hundred and twenty-one households were randomly assigned to either receive one of the three series of postcards, or to receive nothing. Their ongoing daily water consumption was monitored before, during and up to 7 months after the intervention.

Version 1: Water conservation information

Version 2: Descriptive norm

Version 3: Water end-use feedback
Impact
A randomized trial found that during the period postcards were mailed out, mean water use among all households dropped by 10.29 liters per person per day, and the median dropped by 7.6 liters, reductions of 7.3% and 6.2%, respectively. In the post-intervention period the mean water use returned to near pre-intervention levels, however the median water use increased only slightly.
Longitudinal analysis showed that the information only and descriptive norm postcards resulted in rapid water savings, but these changes were lost over time as households returned to their pre-intervention water use levels. Among those receiving the water end-use postcards, by contrast, water use declined more slowly, but the effect of this intervention was longer-lived.

Implementation Guidelines
Inspired to implement this design in your own work? Here are some things to think about before you get started:
- Are the behavioral drivers to the problem you are trying to solve similar to the ones described in the challenge section of this project?
- Is it feasible to adapt the design to address your problem?
- Could there be structural barriers at play that might keep the design from having the desired effect?
- Finally, we encourage you to make sure you monitor, test and take steps to iterate on designs often when either adapting them to a new context or scaling up to make sure they’re effective.
Additionally, consider the following insights from the design’s researcher:
- Due to the necessity of accessing household water consumption data, targeted households in this study were owner-occupiers of dwellings connected to the central water supply with an individual water meter attached to the premises.
- Design postcards to attract the attention of the recipient. Here, for example, cartoon graphics and pie charts were used.
- Rebound effects, in which an intervention’s positive initial effect fades over time, were clear for two of the three information types in the post-intervention period observed.
Project Credits
Researchers:
Kelly Fielding University of Queensland
Sally Russell Griffith University
A. Spinks CSIRO Ecosystem Sciences, EcoSciences Precinct, Dutton Park, Queensland
Rod McCrea CSIRO Ecosystem Sciences, EcoSciences Precinct, Dutton Park, Queensland
Rodney Stewart Griffith University
J. Gardner CSIRO Ecosystem Sciences, EcoSciences Precinct, Dutton Park, Queensland


