Potential Follow-up Increases Voter Turnout
Organization : Harvard Kennedy School
Project Overview
Project Summary
Before the 2010 United States general election, America Votes mailed behaviorally informed letters to unlikely voters in battleground congressional districts to encourage voting.
Impact
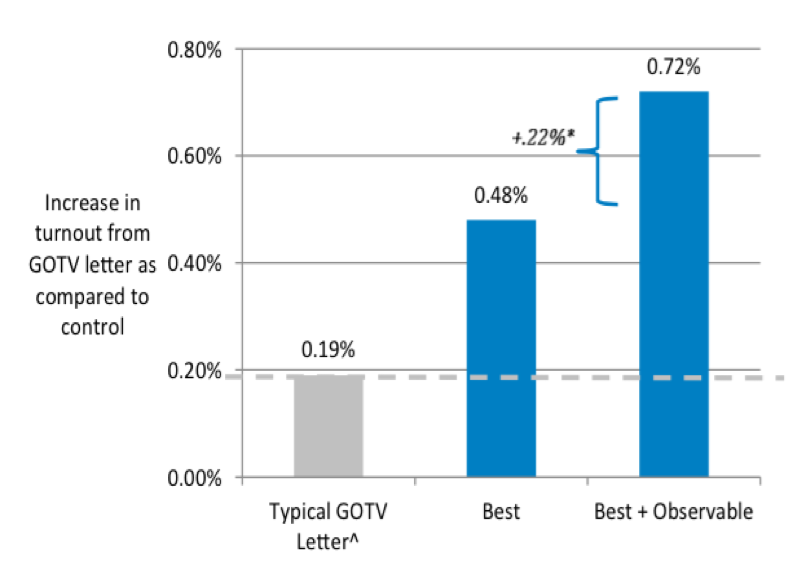
Voter turnout increased by 0.72 percentage points, from 40.88% to 41.60%. This increase in voter turnout is 0.22 percentage points greater than the increase in turnout resulting from GOTV best practices.
Cost
$47 per vote gained.
Challenge
Voting is a public good in that it benefits society and is an important part of a functioning democracy. Yet, many people fail to cast their ballot on election day because the individual benefits from voting are limited. Generally, people contribute more to public goods when their behavior is made more observable to others. However, voting is inherently private: very few people observe whether you actually show up on election day. In addition, existing channels used to encourage people to vote, such as mail or social media, are also inherently private and provide little or no observability. This project’s goal was to build on past get-out-the-vote (GOTV) efforts by creating the perception of observability in communications that encourage people to vote.
Design
Before the 2010 general election, individuals residing in battleground congressional districts with a low to moderate likelihood of voting were targeted by a series of behaviorally informed get-out-the-vote letters.
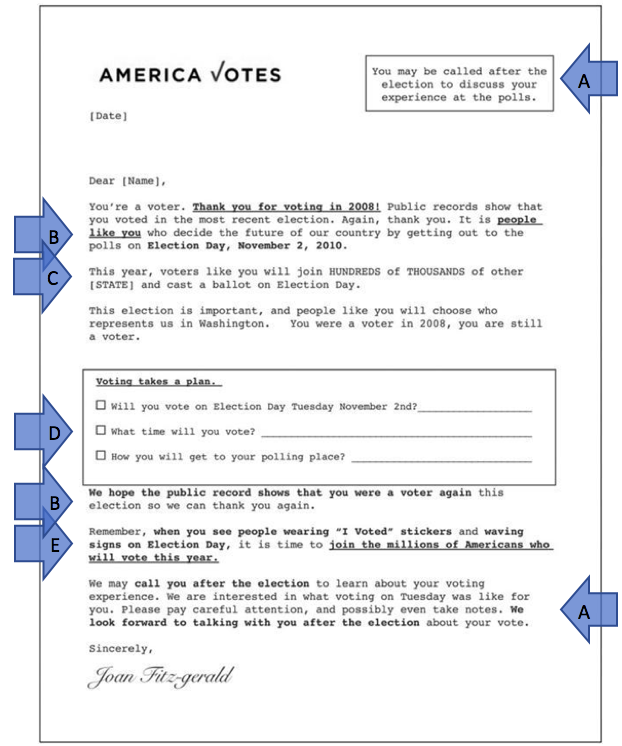
Some of the unlikely voters received letters containing design elements that have previously been shown to increase voter turnout and are considered get-out-the-vote best practices (sections B-E in sample letter below).
Other unlikely voters received identical letters with “enhanced observability.” The observability in these letters stemmed specifically from the following statement in the top right corner of the page: “You may be called after the election to discuss your experience at the polls” and a paragraph at the bottom of the page reinforcing this message.

Letter containing GOTV best practices with enhanced observability to those who voted in 2008
A. Enhanced and reinforced the perceived observability of individuals’ decision to vote
B. Expressed gratitude for the individuals’ past political actions, and a hope that public records would show that individuals will have voted in the upcoming 2010 election. For those who had voted in the 2008 General Election, the letter thanked them for voting in 2008, and for those who had not voted in the 2008 General Election but had registered to vote in the 2010 General Election, it thanked them for registering.
C. Reinforced the civic identity by highlighting that “people like you” will vote
D. Improved implementation intention by having a box in which individuals were to write their voting plans
E. Emphasized the descriptive social norm that many others would vote.
After the election, voter turnout records were compiled from publicly reported administrative records. Elements B-E were present in both the GOTV best practices and enhanced observability letter. Element A was only present in the enhanced observability letter. Element B differed for those who voted in 2008, and those who did not, as noted in the description.
Impact

The “typical GOTV” letter effect is estimated from previous interventions
A randomized evaluation showed that making voting behavior seem more observable in get-out-the-vote (GOTV) letters increased voter turnout by 0.72 percentage points, compared to a typical GOTV letter. In comparison, letters reflecting GOTV best practices which include social descriptive norms, planning prompts, and reinforced civic identity, increased voter turnout by 0.48 percentage points compared to a typical GOTV letter. Overall, the GOTV letters with greater perceived observability were 51% more effective than GOTV letters designed according to best practices.
It is important to note that the individuals included in the study had to reside in battleground congressional districts. They also had to be predicted to be politically “progressive” and to have a low-to-moderate likelihood to vote in the 2010 General Election. This resulted in a population that was 60% female, 15% African American, and averaged 43 years of age. All individuals were randomly assigned to one of three conditions.
Implementation Guidelines
Factors that are especially important to implementing the intervention effectively include:
- If you state you will follow-up, do so to ensure the impact of the statement you make does not diminish with time.
- To ensure the individuals you are targeting receive the letters, you may want to ask them what their preferred medium is (mail, email or social media).
- Make sure the addresses are correct before sending the letter.
Project Credits
Researchers:
Todd Rogers Contact Harvard Kennedy School
John Ternovski Yale University
Erez Yoeli Massachusetts Institute of Technology


